Abstract
Elucidating how the spatial organization of extrinsic signals modulates cell behavior and drives biological processes remains largely unexplored because of challenges in controlling spatial patterning of multiple microenvironmental cues in vitro. Here, we describe a high-throughput method that directs simultaneous assembly of multiple cell types and solid-phase ligands across length scales within minutes. Our method involves lithographically defining hierarchical patterns of unique DNA oligonucleotides to which complementary strands, attached to cells and ligands-of-interest, hybridize. Highlighting our method’s power, we investigated how the spatial presentation of self-renewal ligand fibroblast growth factor-2 (FGF-2) and differentiation signal ephrin-B2 instruct single adult neural stem cell (NSC) fate. We found that NSCs have a strong spatial bias toward FGF-2 and identified an unexpected subpopulation exhibiting high neuronal differentiation despite spatially occupying patterned FGF-2 regions. Overall, our broadly applicable, DNA-directed approach enables mechanistic insight into how tissues encode regulatory information through the spatial presentation of heterogeneous signals.
INTRODUCTION
The ability to recapitulate and investigate complex signaling interactions between constituent cells and their surrounding microenvironment is crucial to elucidating the biological processes that underlie both normal mammalian tissue function and pathological dysfunction (1–3). Soluble cues, cell-cell contact-dependent signals, and “solid-phase” matrix cues coordinate across space and time to encode and transmit regulatory information to instruct single-cell behavior (4). While key insights have been obtained by introducing extrinsic cues to bulk in vitro cultures, fundamental aspects of dynamic, in vivo signaling environments remain unaddressed—namely, the role that spatial variation of cues plays in tuning cell behavior. For example, the spatial modulation of just a single type of ligand has been found to alter cell migration velocities in fibroblasts (5), influence the cell division mode (symmetric versus asymmetric) in single mouse embryonic stem cells (6), tune neurogenesis in adult neural stem cells (NSCs) (7), and direct breast cancer cell invasiveness (8). Biological instruction in vivo, however, is far more complex and can arise from the spatial coordination among multiple ligands (9–12). The fact that cell signaling events are far more nuanced than binary (i.e., either present or absent) demands new engineering strategies that can spatially present multiple, microenvironmental cues in a highly controlled, precise manner in vitro. Such control would enable a deeper understanding of how heterogeneous signaling networks coordinate spatially to tune cell behavior and to direct the underlying cellular processes that orchestrate tissue function (13–15).
Engineering control over multiple biological components while still maintaining high spatial control, however, is a critical challenge with in vitro platforms. Many current patterning techniques fall short as they lack the specificity to multiplex (i.e., pattern multiple ligands, cells, or both). This includes, for example, active cell-patterning methods that use microfluidic (16, 17), acoustic (18, 19), or dielectrophoretic forces to manipulate cells (20, 21). Similarly, indirect capture methods that modulate surface chemistries through either surface charge (22, 23) or the selective deposition of cell-adhesive/resistive materials (24–26) are limited to patterning only one or two cellular components. On the other hand, direct-deposition methods that are capable of recreating multifactorial signaling scenarios—such as ink-jet printing (27), dip-pen lithography (28, 29), and robotic-spot microarray technologies (30–32)—often sacrifice micrometer-scale spatial resolution and/or throughput. While cantilever-free scanning probe lithography offers spatial resolution, “stitching of fields” for scalability and relying on highly specialized, uneconomical tools are key barriers to adoption for those not specialized in the field (33–35). Importantly, none of the aforementioned methods provide simultaneous spatial control of both cells and ligands with respect to each other on the same substrate.
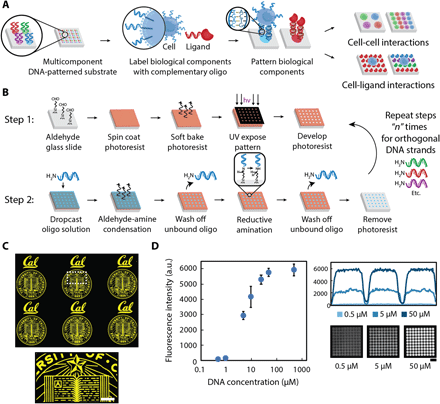
To address these critical limitations, we present a broadly applicable, high-throughput DNA-based patterning platform that can seamlessly direct the parallel assembly of multiple cell types and solid-phase ligand cues across length scales—from tissue-scale structures down to single cells—with unprecedented flexibility and spatial precision. By leveraging traditional photolithographic techniques, which are the current standard for the semiconductor industry, we have engineered a robust yet facile method to fabricate multicomponent, hierarchical patterns consisting of unique 20–base pair (bp), single-stranded oligonucleotides onto a glass substrate. These surface DNA patterns then hybridize with, and therefore direct, the spatial organization of complementary oligonucleotides grafted to signaling solid-phase ligand and/or cells with lithographic resolution. As we demonstrate, arrays consisting of thousands of specific, multiplexed ligand-cell patterns can be fabricated all in parallel (i.e., in “one shot”), a stark contrast to current serial methods in which patterns are assembled in a time-intensive, pixel-by-pixel manner. With these arrays, we can model and study, in a high-throughput and combinatorial manner, spatial heterogeneity during cell-cell communication and cell-ligand signaling (Fig. 1A). To highlight the power of our method for basic biological investigations, we demonstrated one specific application: how the spatial distribution of two competing niche ligands—fibroblast growth factor-2 (FGF-2), which promotes NSC proliferation (36), and ephrin-B2, which drives NSC differentiation (37)—instruct NSC fate decisions at the single-cell level. In so doing, we have uncovered new facets of how the adult NSC niche encodes regulatory information through the spatial organization of a network of fate-guiding signals (38).
(A) Multicomponent patterns of unique 20-bp oligonucleotides instruct the spatial organization of cells and ligands through the hybridization between surface-presented oligonucleotides and complementary oligonucleotide-labeled biological components. (B) Surface DNA patterns are fabricated through the successive utilization of, first, photolithography to define regions of reactive aldehyde groups for oligonucleotide conjugation (step 1) and, second, a reductive amination step to covalently react the amine-terminated oligonucleotides to the aldehyde-functionalized glass surface (step 2). Multicomponent DNA patterns are assembled by patterning a new layer of positive photoresist and repeating steps 1 and 2 using unique oligonucleotides. (C) The use of photolithography enables the fabrication of high-resolution, spatially complex, DNA patterns across a range of length scales—from micrometers to millimeters. Patterned photoresist is used as a mask to conjugate selectively amine-terminated oligonucleotides, which can be visualized by hybridizing a complementary fluorescent oligonucleotide. A surface DNA concentration of 20 μM was used. (D) A dynamic range of surface-DNA pattern intensities (left) can be achieved by tuning the DNA solution concentration. Representative fluorescence intensity profiles (right, top) and their corresponding images of a 40-μm DNA spot array (right, bottom) are illustrated for a low (0.5 μM), medium (5 μM), and high (50 μM) DNA concentration. Error bars are SDs and n = 3. Scale bar, 100 μm. a.u., arbitrary units.
RESULTS
Fabricating hierarchical, multiplexed DNA patterns using photolithography
DNA-instructed assembly provides a simple and robust solution to coordinate multiple signaling components by capitalizing on the specificity and strong, rapid binding kinetics of Watson-Crick base pairing (39, 40). The use of programmable DNA provides unparalleled multiplexing capabilities given the vast sequence space of 20-bp DNA oligonucleotides (i.e., 420 unique sequences). While a previous effort relied on a serial, cantilever-based system with low-patterning throughput and spatial control, our new parallel approach markedly advances the patterning capabilities of DNA-directed assembly and, in turn, the ability to recapitulate complex, heterogeneous signaling environments (41). Specifically, we use patterned photoresist as a physical template to guide the conjugation of unique oligonucleotide strands. The photoresist template can iteratively be stripped and a new one defined to conjugate another set of unique amine-terminated oligonucleotide strands, remarkably without disrupting the previously patterned oligonucleotides. Complex, hierarchical patterns are thus easily assembled. Although our method may appear to be serial because of repeated photolithographic steps to define each DNA component (i.e., layer-by-layer), patterning occurs simultaneously over large areas, and therefore, scaling from a small subset of, for instance, tens of features to millions requires no additional time. Furthermore, given the advanced state of lithography instrumentation in which automated substrate handling and fiducial recognition are commonplace, the need to conduct multiple lithography rounds to fabricate multiplexed DNA patterns is easily achievable.
There are two key steps for achieving this multicomponent, DNA-patterned platform (Fig. 1B). The first involves traditional photolithography, where patterned photoresist serves to (i) expose selective areas of surface aldehyde groups for DNA conjugation, (ii) act as a physical barrier to prevent conjugation to unexposed aldehyde groups, and (iii) preserve protected, unconjugated aldehyde functionality for subsequent, multilayered DNA patterning steps. The second step covalently immobilizes 20-bp oligonucleotides to the glass substrate by reacting the primary amine group at the 5′ end of the DNA with the surface-exposed aldehyde groups. See Materials and Methods for detailed protocol.
Our approach of ultraviolet (UV)–patterning photoresist offers the distinct advantage of defining, with great control and precision, complex spatial patterns across different length scales (i.e., from micrometers to millimeters and, in turn, from subcellular to bulk population) and over large areas (up to thousands of square millimeters) within minutes. High-resolution surface DNA patterns can be generated and visualized by hybridizing a complementary, fluorescent oligonucleotide (Fig. 1C). Unlike direct-write technologies, in which the active patterning step can be time intensive, the essential patterning steps of our platform focuses on a simple 1-min or less UV exposure step and subsequent DNA conjugation. In-depth characterization of DNA-patterning steps has revealed that optimization of both the buffer composition and the combination of condensation time and temperature play critical roles in achieving robust, uniform surface DNA patterns (fig. S1). An additional key advantage of our method is the tunable control that we have over DNA concentrations patterned onto the substrate. For example, by varying the concentration of the oligonucleotide solution dropcast over the photoresist patterns, we achieved a >100-fold range of fluorescent intensities (Fig. 1D). Having such precise control enables investigations of biological events in which variations in signal concentration, such as morphogen gradients during development, occur (42).
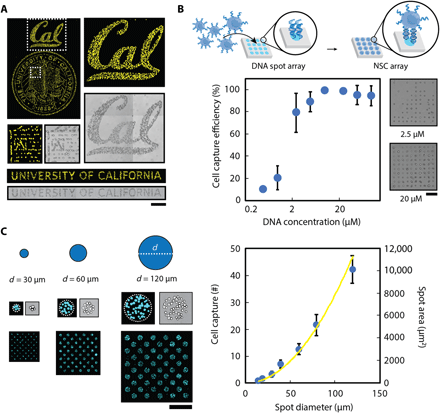
To demonstrate the functional utility of our platform, we first used microfabricated DNA patterns to organize an oligonucleotide-labeled (43) NSC population with high spatial precision, demonstrating the potential to recreate complex cell-based tissue structures (Fig. 2A). Next, to determine the minimum DNA concentration necessary for patterning single cells, we tested cell capture efficiencies of 20-μm-diameter spot arrays over a concentration range from 0.5 to 100 μM. A minimum of 5 μM was necessary to capture at least one oligonucleotide-labeled NSC per spot (Fig. 2B). Above this concentration, >90% of patterned spots were occupied. While DNA concentration can influence cell capture, so too can microfabricated pattern feature size. Increasing the diameter of DNA-patterned circle features resulted in a robust and reproducible increase in the number of cells captured per spot (Fig. 2C). Moreover, when the diameter was commensurate with the size of NSCs (~15 μm), single-cell capture was achieved. As we demonstrate later, this capability enables high-throughput clonal analysis.
(A) Patterned surface oligonucleotides organize a fluorescently labeled population of NSCs with high spatial precision through Watson-Crick base pairing between the surface-conjugated DNA and the temporary lipid-modified DNA tethered to the cell membranes. (B) Cell capture efficiency of 20-μm-diameter DNA spot patterns was dependent on the concentration of DNA solution with a significant drop of efficiency occurring at a concentration below 5 μM (left). This is seen in the representative NSC-patterned images of a 10 × 10 array of 20-μm-diameter DNA spots for a range of concentrations (right). (C) The number of DNA-captured cells can be controlled by tuning the feature size of the DNA patterns. Representative images (left) demonstrate DNA spots with different diameter dimensions capturing varying numbers of fluorescently labeled NSCs. Moreover, an increase in diameter size of DNA-patterned spots (right) results in an increase in cell capture number (blue dots) that follows a similar increasing trend in spot area (yellow line). Unless noted otherwise, a surface DNA concentration of 20 μM was used for all experiments. All error bars are SDs, and n values are reported in table S2. Scale bars, 500 μm.
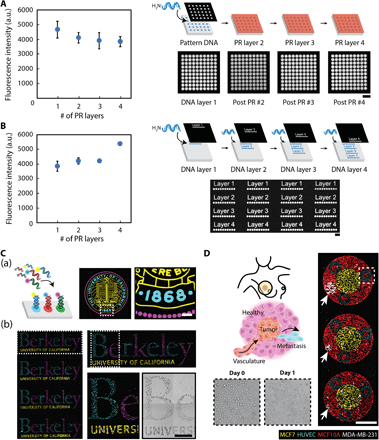
To fabricate multicomponent DNA patterns, we found that the aforementioned two-step process can be repeated after dissolving the patterned photoresist in acetone. A new photoresist layer can then be applied to define a new spatial pattern that, in turn, guides the conjugation of additional oligonucleotide strands. To validate the robustness and reproducibility of this iterative process, we first demonstrated that the application of three additional photoresist layers does not adversely affect the first DNA-patterned layer’s functionality (i.e., ability to hybridize) (Fig. 3A). Rather, the application of new photoresist layers preserves the integrity of the previously patterned DNA layers while also allowing for the selective exposure of additional aldehyde regions for multicomponent conjugation (fig. S2). Second, we demonstrated that the actual photolithographic steps—particularly, (i) resist baking at 100°C, (ii) resist removal with acetone (an aggressive solvent), and (iii) resist development with a highly alkaline solution (pH ~13 and highly corrosive)—do not compromise the aldehyde groups on the glass substrate, as DNA patterns fabricated from subsequent layers retained high-intensity fluorescent values (Fig. 3B). Extensive characterization established that multilayer patterning can be remarkably extended to at least 10 layers without loss of fidelity (fig. S2C). Moreover, tunability of patterned DNA concentration can be achieved for multiplexed DNA patterns (fig. S3).
Characterization of multiple fabrication steps highlights the compatibility of photolithography with DNA patterning. (A) The integrity of surface DNA patterns is preserved—as indicated by the ability to hybridize with its complementary, fluorescent oligo counterpart—when subjected to repeated photolithographic fabrication steps, as would occur when patterning multiple DNA layers [i.e., removal of photoresist (PR) with acetone and patterning of a new layer]. Despite a slight initial drop upon the application of a second PR layer, the average fluorescence intensity of DNA-patterned features remains robust upon a third and fourth photolithography step. Curved black arrow indicates surface patterning of amine-terminated DNA oligonucleotides. (B) The functionality of the surface-modified aldehyde groups, which is necessary for DNA conjugation, is also preserved during successive PR layer applications. Additional photolithography steps yield surface DNA patterns with robust fluorescent intensities. Scale bars, 100 μm. All error bars are SDs and n = 3. Curved black arrows indicate surface patterning of amine-terminated DNA oligonucleotides. (C) (a) Micrometer-scale registration of three complex DNA patterns was patterned and visualized with unique complementary fluorescent oligonucleotides. Curved black arrow indicates the addition of fluorescent oligonucleotides and subsequent hybridization with the surface-patterned DNA strands. (b) To highlight their functionality, multicomponent DNA patterns assembled three distinct, fluorescently tagged NSC populations with high spatial control and specificity by labeling each population with unique complementary, lipid-modified oligos that insert into the cell membrane. (D) DNA surface patterns direct the parallel assembly of four unique cellular components to construct an in vitro breast cancer microenvironment that mimics early metastasis. An inner circular pattern of MCF-7s represents the primary tumor and is encased within an outer circular layer of nonmalignant breast epithelial MCF-10As. Vasculature is represented by HUVEC patterns, structured as vessel cross sections. White arrows highlight the varied circular pattern diameter of the final invasive cell type, MDA-MB-231, representing clusters of cancer cells that have escaped the primary tumor site and corresponding to different potential scenarios of the initial stages of metastasis. White dashed box (top right) corresponds with the day 0 and 1 zoom-in images (bottom left) of the HUVEC patterns embedded within the MCF-10A outer-patterned layer. A surface DNA concentration of 20 μM was used for all experiments. Scale bars, 500 μm.
While photolithography imparts high spatial control in defining each DNA layer, it also enables tight spatial coordination between layers. Figure 3C(a) and Fig. 3C(b) highlight the successful registration of three complex DNA patterns and the robust functionality of multiplexed surface DNA patterns, respectively. As a demonstration of the biological utility of this key capability, while also emphasizing the broad applicability of our platform to assemble cell types other than NSCs, we used four different cellular components to mimic different stages of early metastasis that could potentially occur in a breast cancer microenvironment (Fig. 3D). Specifically, we patterned malignant breast epithelial MCF-7 cells (representing the “primary tumor”) surrounded by nonmalignant breast epithelial MCF-10A cells (representing “normal tissue”). We also patterned human umbilical vein endothelial cells (HUVECs) within the MCF-10As to represent vasculature. Last, we assembled a cluster of invasive triple-negative breast cells (MDA-MB-231) at the periphery (white arrows). The size and spatial separation of the MDA-MB-231 cluster from the MCF-7s represent different potential scenarios of the initial stages of metastasis, in which a subset of cancer cells has lost their adhesion to the primary tumor site and, with their migratory and invasive properties, have escaped into ultimately the surrounding tissue. Our patterning method provides a foundation to investigate the many cellular components of the highly complex breast cancer microenvironment in a reductionist manner. Repeating arrays of the DNA-patterned co-cultures can be assembled simultaneously with different cell component ratios tuned with high spatial precision.
Multicomponent DNA patterns instruct the presentation of heterogeneous proteins
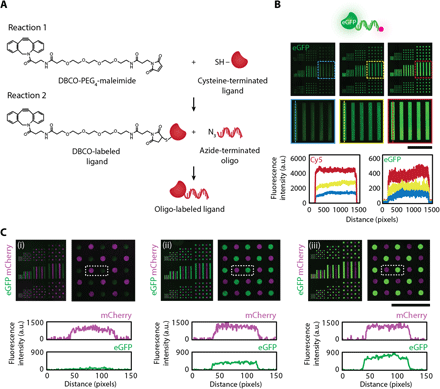
A key step for demonstrating the unique capabilities of our DNA-directed strategy is using the surface DNA patterns to control the spatial organization of solid-phase ligands. Having such control would enable one to recapitulate the presentation of both extracellular matrix (ECM)–sequestered and cell surface–tethered signals found in specific tissue niches. Our approach of using DNA as a programmable intermediary capture agent ensures that multiple ligands, each labeled with a different complementary oligonucleotide, can be assembled from a single mixed solution flowed across the DNA-patterned surface. To label ligands-of-interest with oligonucleotides, we used the heterobifunctional linker dibenzocyclooctyne (DBCO)–polyethyleneglycol (PEG4)–maleimide because of the quick and reliable high reaction efficiencies that could be achieved (Fig. 4A). Briefly, ligands were designed to contain a free terminal cysteine to react with the maleimide group on the cross-linker, thereby introducing a DBCO moiety on the ligand that allows for subsequent click chemistry reaction with an azide-modified oligonucleotide label (see Materials and Methods). As a proof of concept, we conjugated an oligonucleotide to recombinant enhanced green fluorescent protein (eGFP). Surface DNA patterns directed the spatial organization of eGFP and successfully maintained robust protein patterns over long-term cell culture (fig. S4A). In addition, neither eGFP lacking an oligonucleotide label nor eGFP containing a noncomplementary label resulted in protein capture (fig. S4B), indicating that complementary DNA sequences were necessary to achieve high specificity of eGFP patterns. To visualize and quantify the relative concentrations of patterned ligands, we included a Cy5 dye at the 3′ end of the oligonucleotide label (Fig. 4B). Last, to highlight that spatial control could be extended to multiple solid-phase cues, we conjugated a second oligo strand to mCherry and demonstrated tunable patterns of mCherry and eGFP (Fig. 4C).
(A) The heterobifunctional linker DBCO-PEG4-maleimide enables covalent labeling of ligands of interest with an oligonucleotide label. A free sulfhydryl group on the protein is reacted first with the maleimide moiety on the cross-linker, introducing a DBCO functional group to the ligand that then reacts via click chemistry to an azide-terminated oligonucleotide. SH, thiol group. (B) The incorporation of an oligonucleotide label having a fluorescent tag enables imaging and monitoring of DNA-directed ligand patterns. For proof of concept, eGFP with a Cy5 tag was assembled using DNA surface patterns (top). Trends in fluorescence intensity profiles for the patterned protein and the fluorescent tag closely matched one other when tuning surface DNA concentrations (2, 4, and 10 μM, from left to right), suggesting that the fluorescent oligonucleotide label can also be used as a relative readout of patterned protein concentration (bottom). (C) Multicomponent DNA surface patterns enable tunable control over each ligand concentration as evident in the DNA assembly of eGFP and mCherry. mCherry concentration was held constant as eGFP concentration was tuned as quantified by the change in eGFP fluorescence intensity (bottom) and visualized in the fluorescent composite images (top). Surface DNA concentration for mCherry was 20 μM. Surface DNA concentration for eGFP was 1, 2, and 20 μM (left to right). Scale bars, 500 μm.
Applying multiplexed DNA patterns to dissect NSC fate competition
As a first biological demonstration of our method’s unique capabilities, we focused on modeling complex signaling scenarios within the adult NSC niche. Stem cell niches are canonical examples of specialized microenvironments that coordinate the behavior (i.e., quiescence, migration, lineage commitment, etc.) of residing stem cells in response to physiological or pathological directives (44–46). Stem cells must continuously decide whether to self-renew or to differentiate into specialized, mature progeny, and the complex balance between these two competing fate choices ensures that a stem cell population can maintain homeostasis and respond to organismal needs. Here, we investigated how adult hippocampal NSCs resolve a competition between opposing fate cues and to what extent spatial organization of signals offers biophysical context to inform this decision. We leveraged our technique’s spatial control over both cells and solid-phase cues to model solid-phase ligand competition between FGF-2 and ephrin-B2 at the single-cell level. While FGF-2 operates as both a soluble (36) and ECM-sequestered cue (47) to promote proliferation and stem cell maintenance, ephrin-B2 is a key signal presented on the surface of neighboring astrocytes that drives neuronal differentiation via physical cell-cell contact, signaling through the EphB4 receptor (ephrin type-B receptor 4) on NSCs (37). We exposed thousands of patterned, spatially segregated, single-NSC cultures to distinct spatial organizations of the competitive ligands and conducted time-lapse experiments to study and correlate the dynamics within these cultures with endpoint cell fate.
To interrogate single-cell behavior with our DNA-based platform, we microfabricated large arrays of 15-μm-diameter DNA spots to direct the capture of oligonucleotide-labeled single NSCs. We then lithographically patterned a cell-resistive, nonbiofouling material, polyacrylamide (PA), to define recurring arrays of 50 × 50 “microislands” (each 141 μm by 141 μm) (fig. S5A) (48). The combination of DNA and PA patterns provided the high-throughput power to organize and track thousands of single-NSC cultures (each culture confined to a single microisland) in parallel over a 5-day differentiation period. To recapitulate the NSC niche ECM while also enabling cell attachment, we introduced laminin and incubated it within the microislands following single-cell patterning (fig. S5B) (see Materials and Methods). Within our DNA-directed, single-cell microisland arrays, NSCs demonstrated expected proliferation and differentiation responses to soluble FGF-2 and differentiation medium, respectively, suggesting that lipid-DNA labeling had negligible biological effects on NSC behavior (fig. S6). This was validated further through in-depth characterization of NSC viability (fig. S7) and fitness (fig. S8), highlighting our platform’s compatibility with a more sensitive cell type (i.e., stem cells) and potential utility for a wide variety of other cell applications—from examining juxtacrine versus paracrine heterogeneous cell-cell interactions at the single-cell level (fig. S9) to recapitulating tissue-like structures (fig. S10).
Having established that photolithographically-defined DNA and PA patterns can support the high-throughput study of thousands of single-NSC cultures over the course of differentiation, we then prepared both niche cues, FGF-2 and ephrin-B2, by labeling each ligand with unique oligonucleotides containing a Cy3 and Cy5 fluorescent dye, respectively, for visualization (fig. S11). Because of the challenge of producing recombinant ephrin-B2 in high yield, we replaced the full-length protein with a mimetic peptide, TNYLFSPNGPIARAW, that exhibits nanomolar binding affinity to its cognate EphB4 receptor (49). When presented as a monomeric, soluble cue, the peptide was insufficient in inducing strong neuronal differentiation (fig. S12A). However, upon surface immobilizing via DNA hybridization, the peptide induced receptor clustering (fig. S12B) and resulted in Tuj1+ differentiation in single NSCs (fig. S11D). In contrast to FGF-2, which, in solid-phase form, acted as a potent activator of proliferation, a minimum concentration threshold was necessary to promote peptide-induced Tuj1+ differentiation. These results not only highlighted ligand activity across a range of concentrations but also informed our subsequent biological investigation by identifying appropriate patterning conditions to model ligand competition.
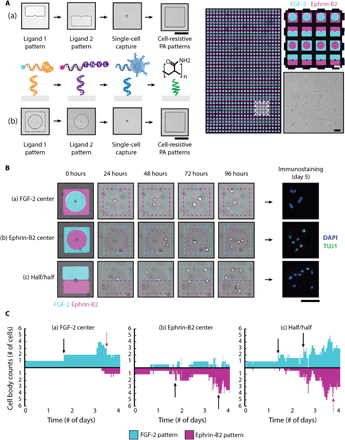
Upon validating that FGF-2 and the ephrin-B2 mimetic peptide individually drive divergent cell fates in single NSCs, we used our DNA-based method to assemble and model scenarios in which NSCs are presented with both conflicting cues, thereby emulating the expression of both of these signals by hippocampal astrocytes contacting NSCs (37, 50). By growing the complexity of our in vitro models to better mimic heterogeneous in vivo niches, we are striving to obtain a fundamental understanding of the complex relationship between proliferation and differentiation, a necessary step in realizing NSC-based therapies. We capitalized upon our system’s robust spatial control over both ligands and cells to modulate ligand presentation within single-cell microisland cultures. Two DNA-patterning strategies were thus implemented in parallel (Fig. 5A). The first constrained single NSCs to the center of either an FGF-2 or ephrin-B2 peptide circular region with the second ligand patterned around the microisland periphery. The second strategy positioned single NSCs at the interface between two, half/half ligand patterns with equal access to both solid-phase cues. Thousands of microislands encompassing all three spatial arrangements were assembled simultaneously to ensure sufficient statistical power, as shown in Fig. 5A (right).
(A) Overview of two four-layer DNA patterning schemes that direct the assembly of FGF-2, ephrin-B2 mimetic peptide, single NSCs, and PA patterns (left). (a) The top PR patterns segregate each ligand to one-half of the microisland, exposing the patterned single NSC to both solid-phase cues equally, while (b) the bottom PR patterns forces the presentation of one ligand over the other. A representative image (right) of a large-area microisland array contains both presentation strategies; the patterned ligands are visualized by their respective fluorescent oligonucleotide labels (FGF-2 in cyan and ephrin-B2 in magenta). The zoomed-in insert highlights the simultaneous assembly of three different spatial presentation configurations: half/half, FGF-2 center, and ephrin-B2 center. (B) Representative time-lapse images illustrating cell proliferation and migration for three sample microislands of the different ligand spatial configurations and their corresponding day 5 immunostaining results: (a) FGF-2 center, (b) ephrin-B2 center, (c) half/half. DAPI, 4′,6-diamidino-2-phenylindole. (C) Quantification of cell body counts within FGF-2 (cyan) and ephrin-B2 (magenta) patterns over 4-day time lapse using custom analysis script, corresponding to the same three sample microislands in (B). Black arrows indicate proliferation events, and red arrows indicate cell death. A surface DNA concentration of 20 μM was used for all patterned components. Scale bars, 100 μm.
Microislands were imaged over the course of a 4-day time lapse (movie S1) to track cell body distributions across the ligand-patterned regions. Time-lapse snapshots of (i) FGF-2–center, (ii) ephrin-B2–center, and (iii) half/half microislands (left) along with their corresponding day 5 immunostaining results (right) are provided in Fig. 5B. Custom computational analysis (fig. S13) (51) provided the capability to map out the dynamic cell-ligand interactions of each microisland culture and track how the initial parent NSC and its subsequent progeny distributed themselves over time in response to the organization of these competing niche cues (Fig. 5C).
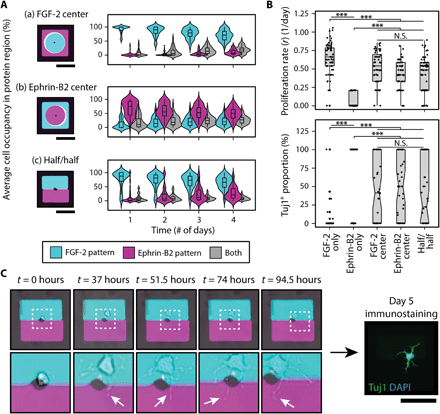
We first investigated how spatial modulation of FGF-2 and ephrin-B2 “domains” shaped the interactions of the single-NSC cultures with these two competing niche ligands. For the FGF-2–center microislands, we observed high-average cell occupancy within the FGF-2 domain that persisted over all 4 days [Fig. 6A(a)]. In contrast, ephrin-B2–center microislands exhibited a much wider distribution of average cell occupancies in the ephrin-B2 region on the first day alone [Fig. 6A(b)], and, by the second day, most of the cells no longer substantially occupied ephrin-B2. This observation was further corroborated upon analyzing the half/half microislands, where single NSCs had the freedom to “choose” either protein-patterned region [Fig. 6A(c)]. Here, average cell occupancy within FGF-2 remained far greater than within ephrin-B2 or at the interface of both domains. The overall strong spatial bias toward FGF-2–patterned regions in all cases may have been driven by the ephrin-B2 mimetic peptide acting as a repulsive cue, which would align with previous findings of Eph/ephrin guiding tissue-boundary formation and axon extension through cell repulsion (52).
(A) Average cell occupancy of cell bodies within the FGF-2 (cyan), ephrin-B2 (magenta), and spanning both (gray) protein-patterned regions was tracked over time for each of the three ligand spatial presentations: (a) FGF-2 center, (b) ephrin-B2 center, and (c) half/half. A strong spatial bias toward FGF-2 was observed. (B) Analysis of end fate through quantification of proliferation (top) and neuronal differentiation (bottom) reveals that, despite spatial preference toward FGF-2, some NSC microislands integrated both signals, generating significant heterogeneity. (C) Time-lapse snapshots (left) of a microisland exhibiting 100% neuronal differentiation (right) despite having near 100% FGF-2 occupancy throughout the 4-day culture reveal dynamic neurite processes (indicated by white arrows) occupying both FGF-2 and ephrin-B2 patterns. White, dashed boxes correspond to below zoom-in images. n = 55 for each ligand presentation. All P values were obtained from Tukey-Kramer test. ***P < 0.001. N.S., not significant. Scale bars, 100 μm.
Having observed that NSCs prefer FGF-2 over ephrin-B2 surfaces, an observation that would not have otherwise been achieved given the limitations of other patterning techniques, we then immunostained clonal cultures to investigate whether this cell occupancy bias translated to cell fate decisions. A comparison of the three different ligand spatial presentations to FGF-2– and ephrin-B2–only microislands (Fig. 6B) revealed that one niche signal unexpectedly did not exclusively dominate over the other with regard to cell fate. The three different ligand-competition scenarios resulted in proliferation rates that were significantly higher than the ephrin-B2–only condition yet significantly lower than the FGF-2–only microislands. With regard to differentiation, we anticipated that the NSC’s preference to reside in the FGF-2 domains would result in a more proliferative, stem-like state. However, no significant differences in proliferation rate or Tuj1+ differentiation were detected between the three spatial organizations. Moreover, an unexpectedly wide distribution of neuronal differentiation proportions was observed, including microisland subpopulations spanning both extremes of 100 and 0% Tuj1+ neuronal differentiation. The observed mix of proliferation and differentiation (fig. S14A) strongly indicates that the cells were integrating both signals and that the added presence of either cue is insufficient to instruct or completely alter cell fate decisions, despite NSC’s spatial preference toward occupying FGF-2. The simultaneous sensing of both cues highlights the inherent complexity and heterogeneity of NSC behavior as survival, proliferation, and differentiation are balanced to yield a desired number of new neurons while maintaining a stem cell reservoir. Further in-depth single-cell analysis is required to identify specific contributing factors that give rise to this heterogeneity, and our platform uniquely provides the resolution to do so.
We next dissected the dynamics of individual microislands by tracking the changes in average cell body occupancy within the FGF-2–patterned region over time and subsequently grouped microislands according to end fate (fig. S14B). However, rather than observing a minimum and/or maximum occupancy threshold that predicts endpoint cell fate, microislands with similar FGF-2 occupancy patterns were spread across all three neuronal differentiation categories [“Low (0%),” “Medium (0 to 100%),” and “High (100%)”]. More remarkably, we identified an unexpected subset of single-NSC cultures that underwent differentiation despite having nearly 100% FGF-2 occupancy. A closer examination of these specific cultures (Fig. 6C) revealed a potential source for this paradox: Neurites were extending across into the ephrin-B2 region, such that cells could potentially sense and probe both protein patterns throughout differentiation. While it currently remains unclear whether transient sampling of the ephrin-B2 differentiation cue by a short neurite is sufficient to drive a long-term, cell fate decision, future work focused on tracking neurite dynamics and analyzing temporal aspects of cell occupancy within each ligand-patterned region could elucidate further how single NSCs sense and integrate conflicting instructive cues.
DISCUSSION
Here, we introduced a high-throughput, parallel strategy to fabricate instructive, multiplexed surface DNA patterns that enable the recapitulation and dissection of complex, multivariable biological signaling environments in vitro. Our approach of using photolithography lends the distinct advantage of coordinating unique DNA strands with tight spatial control onto a glass substrate, which then guide the subsequent organization of ligands and cells into multiplexed patterns in (i.e., “one shot”). Unlike current patterning methods that build up cell or ligand patterns in a serial (pixel-by-pixel), time-intensive manner within a confined area, our use of photolithography affords a simple, yet robust, high-throughput approach to template DNA patterns over large areas (i.e., thousands of square millimeters or larger) with micrometer-scale precision. Multilayer lithography can be performed to conjugate at least 10 different oligonucleotide strands, all while maintaining spatial control and functional integrity of prior DNA-patterned layers. Moreover, scaling to a manufacturing level is feasible given the well-established infrastructure and processes for multilayered lithographic patterning within industry.
The unique power of our method to address complex biological questions stems from the multiplexed DNA-based control over multiple cell types at both the bulk and single-cell level and from the isolated presentation of cell-tethered ligands or ECM-sequestered solid-phase cues with high spatial precision. We demonstrated that our multiplexed cellular control can provide a foundation to study complex biological processes at a bulk, tissue scale and be used to assemble and tune heterogeneous cell-cell interactions with single-cell control. In addition, extending our patterning capabilities to include DNA-instructive control over ligands enables a reductionist approach to investigate the effect of one or more specific, patterned ligands on thousands of single-patterned cells. Although we identified that a two-step conjugation using a DBCO-PEG4-maleimide cross-linker offers a simple yet efficient method for conjugating an oligonucleotide label to a ligand-of-interest, other chemistries could be pursued—so long as a ligand-oligonucleotide conjugate is produced and ligand activity is preserved. This includes the use of site-specific conjugation strategies, such as HaloTag and SNAP-tag, which are particularly well suited for ligands that (i) do not have a free cysteine or (ii) have an abundance of free cysteines (see the Supplementary Materials).
As a first demonstration of our platform’s biological utility, we used our method to dissect the influence of the spatial presentation of competing cues, FGF-2 and ephrin-B2, within the adult NSC niche. We found that NSCs have a strong preference to reside within the FGF-2 region. Most unexpectedly, we identified a small population that differentiated despite showing bias toward FGF-2—a result that may be attributed to dynamic neurites extending into ephrin-B2. This unexpected finding was possible because our method has the fine-tuned control to assemble multiple ligands simultaneously across thousands of single-cell cultures, enabling in-depth clonal analysis. Future studies include dissecting the role of neurites on receptor activation as well integrating other analysis techniques, such as single-cell Western blotting and single-cell RNA sequencing, to illuminate further other key downstream targets and mechanisms. Generation of a Tuj1 reporter cell line would also enable real-time monitoring of differentiation.
While our method provides the ability to model and study complex signaling environments in vitro, achieving submicrometer features (<250 nm) could be challenging as pattern resolution is diffraction limited to the wavelength of light used to pattern the resist (hundreds of nanometers), the numerical aperture of the lens used for patterning, and the type of resist itself. For these cases, a strategy using electron-beam lithography could be devised to create templates. An additional limitation is that the resulting planar structures achieved with our approach may not fully capture the complexity of in vivo three-dimensional (3D) structures. To achieve 3D structures, one could potentially use a combination of deoxyribonuclease and Matrigel to release and embed patterned structures, respectively (53). Last, as multiplexing is increased, hybridization specificity is key to ensure precise control over heterogeneous cells and ligands. This requires optimal oligonucleotide sequence design in which noncomplementarity between sequences and minimal secondary structures are desired (see Materials and Methods).
Overall, our novel platform’s use of established photolithographic techniques affords a low-adoption barrier, where this system can be easily used to elucidate complex signaling logic across a broad range of cells and tissues, such as the nervous system, immune system, and the tumor microenvironment. Increased pattern complexity, as would be required for modeling tissue-like structures, such as the hippocampal dentate gyrus, hepatic lobules, and intestinal crypts, is possible given the ease and parallel nature of photolithography. Moreover, our method serves as an ideal first step to inform time- and resource-intensive in vivo studies given its ease in implementation. The powerful patterning flexibility and reproducibility of our parallel, DNA-directed strategy not only offer unparalleled capabilities in modeling heterogeneous in vivo signaling environments with controlled spatial presentation but also facilitate in-depth investigations of complex problems in systems biology and human disease.
MATERIALS AND METHODS
Oligonucleotide sequence design
DNA oligonucleotides were purchased from both Integrated DNA Technologies, Inc. and Eurofins, resuspended as 2 mM stocks in molecular biology–grade water, and stored at −20°C until ready to use. Sequences were designed for noncomplementarity and minimal secondary structure with the aid of the DINAMelt online software package (http://unafold.rna.albany.edu/?q=DINAMelt/software). After sequences were computationally designed, sequences were tested empirically for specificity.
Micropatterning 20-bp amine-terminated oligonucleotides with positive photoresist
Traditional photolithography was used to pattern aldehyde glass substrates with positive photoresist. S1813 photoresist (Shipley) was spun onto aldehyde-functionalized glass slides (Schott Nexterion) at 3000 rpm for 30 s and subsequently heated for 1.5 min on a 100°C hotplate. Photoresist-coated aldehyde slides were exposed selectively to UV light (365 nm; 260 mJ cm−2) with a mask aligner (Karl Suss MJB 3) using a custom mylar mask (FineLine Imaging). Patterns were developed using MF-321 developer (Shipley), washed with 18-milliohm deionized (DI) water, and dried with dry nitrogen gas. Resolution of patterning is limited by the wavelength of light used in the exposure system.
Immediately following photolithography, a 5′-amine–modified, 20-bp oligonucleotide solution prepared in 50 mM sodium phosphate buffer (pH 8.5) was dropcast over the photoresist patterns. Slides were covered with a petri dish to prevent evaporation, and the DNA solution was allowed to incubate for 5 min. Slides were then heated for 1 hour in a 75°C oven to induce the formation of Schiff bonds (C═N) between the terminal amine on the DNA and the aldehyde on the glass surface. Slides were then briefly submerged in 0.4% SDS in DI water and rinsed with plain DI water to remove excess DNA. To covalently conjugate the DNA strands to the surface aldehyde groups—thereby converting the hydrolysable Schiff base to single C─N bonds—reductive amination was conducted at room temperature for 15 min in 0.25% sodium borohydride (Sigma-Aldrich) in 1× phosphate-buffered saline (PBS). Upon completion, a second rinse with DI water was performed. To remove the positive photoresist, slides were thoroughly rinsed first with acetone and then DI water, followed by drying with dry nitrogen gas.
The above steps were repeated to micropattern multiple DNA strands, starting with spinning on a new layer of positive photoresist. To align multiple DNA patterns, a microscope with a 10× objective was used to register fiducial markers on subsequent mylar photomasks to prefabricated metal alignment markers on the DNA glass substrate. Completed DNA-patterned slides were stored under vacuum until ready for biopatterning. A complete list of DNA sequences is provided in table S1.
Patterning metal fiducial markers for multicomponent DNA registration
Before all DNA patterning, metal alignment markers were fabricated on the aldehyde glass substrate using standard photolithography. Similar to DNA patterning, positive photoresist (Shipley 1813) was photopatterned using a mask aligner (Karl Suss MJB 3) followed by the deposition of a 100-Å thin film of titanium via electron-gun evaporation. Photoresist and excess metal were removed by acetone lift-off. Slides were then washed with DI water, dried with dry nitrogen gas, and stored under vacuum. Precision of DNA pattern registration is limited by lithographic alignment.
Characterizing DNA patterns with complementary fluorescent DNA
Substrates were blocked at room temperature in 2% bovine serum albumin (BSA, Sigma-Aldrich) in 1× PBS (pH 7.4) for 1 hour to minimize nonspecific adsorption. Complementary, fluorescently tagged oligonucleotides were prepared at 0.2 μM in 2% BSA and incubated for 5 min on a shaker at room temperature. The substrate surface was then washed four times with PBS and imaged using an ImageXpress Micro (IXM) high-throughput, automated imager. Complementary oligonucleotide sequences and their conjugated fluorophores are listed in table S1.
Cloning and expression of cysteine-terminated recombinant proteins in Escherichia coli
The DNA fragments encoding eGFP and mCherry were subcloned into a T7 expression vector with a 6×His-tag at the N terminus to allow for downstream purification and a Cys residue at the C terminus to enable conjugation with a single-stranded oligonucleotide label. A T7 plasmid containing 6×His–FGF-2–Cys was a gift from the University of California (UC) Berkeley QB3 MacroLab facility. All constructs were confirmed via sequencing and subsequently transformed into Rosetta 2 (DE3)–competent E. coli cells.
For protein production, 20 ml of an overnight culture was seeded into 1 liter of Terrific broth supplemented with ampicillin (100 μg ml−1) and allowed to grow at standard growing conditions (37°C, 220 rpm) until an OD600 (optical density at 600 nm) = 0.6. The culture was then induced with isopropyl-β-d-1-thiogalactopyranoside (Thermo Fisher Scientific) at a final concentration of 1 mM and allowed to shake for an additional 6 hours at 30°C before being harvested by centrifugation (5000g, 20 min, 4°C). Bacterial pellets were stored at −80°C until ready for purification.
Recombinant protein purification using gravity flow chromatography
Frozen bacterial pellets were thawed on ice and resuspended in 30 ml of lysis buffer [50 mM NaH2PO4, 300 mM NaCl, and 10 mM imidazole (pH 8)] supplemented with lysozyme (1 mg ml−1; Sigma-Aldrich), phenylmethylsulfonyl fluoride (200 μg ms−1; Sigma-Aldrich), and 20 mM 2-mercaptoethanol (Sigma-Aldrich). After incubating on ice for 30 min, cells were sonicated for 2 min at 60 W (10-s on/10-s off) to ensure complete lysis, and cell debris was pelleted via centrifugation (28,000g, 1 hour, 4°C). The collected supernatant was purified using gravity flow chromatography with a bed of Ni–nitrilotriacetic acid agarose (QIAGEN). Wash buffer containing 50 mM imidazole was used to remove nonspecific binding of background proteins, and elution buffer containing 250 mM imidazole was applied to the column to elute the His-tagged protein of interest. Elution fractions were separated using SDS PA gel electrophoresis (NuPAGE 4 to 12% Bis-Tris Protein Gel, Thermo Fisher Scientific) and analyzed via Coomassie staining (R-250, Thermo Fisher Scientific). Fractions containing protein of interest were then pooled, and dialysis was performed using a 10-kDa Slide-A-Lyzer cassette (Thermo Fisher Scientific) overnight at 4°C with two solution changes to eliminate excess imidazole as well as desalt the collected protein into storage buffer [1× PBS, 0.5 mM EDTA, 10% glycerol (pH 8)]. The Pierce BCA Protein Assay (Thermo Fisher Scientific) was used for protein quantification.
Labeling of cysteine-terminated recombinant protein with azide-terminated oligonucleotide label using DBCO-PEG4-maleimide heterobifunctional cross-linker
Immediately before use, a 10 mM solution of DBCO-PEG4-maleimide (Jena Bioscience) was prepared in anhydrous dimethyl sulfoxide and reacted, at a fourfold molar excess, with the protein of interest (i.e., eGFP, mCherry, or FGF-2) diluted to 0.1 mM in conjugation buffer [1× PBS with 1 mM EDTA (pH 7)]. The conjugation was reacted overnight at 4°C on a tube rotator. The next day, excess DBCO was removed, and the buffer was exchanged to 1× PBS (pH 7) using a 10-kDa Amicon Ultra-0.5 ml Centrifugal Filter (EMD Millipore). The DBCO-reacted protein-of-interest was then reacted, at a threefold molar excess, with an azide-terminated oligonucleotide label overnight at 4°C on a tube rotator. Reaction efficiency was assessed by running the product on a reducing SDS PA gel (NuPAGE 4 to 12% Bis-Tris Protein Gels, Thermo Fisher Scientific) and subsequently imaging the gel using a flat-bed fluorescent scanner (Typhoon 8600, Molecular Dynamics), probing for the fluorescent tag modifying the oligonucleotide label (fig. S11). In the case where overlabeling may be a concern, protein activity can be compared before and after conjugation. Protein-oligonucleotide conjugate was stored at −20°C until ready to use.
Labeling of cysteine-terminated EphB4-binding peptide with azide-terminated oligonucleotide label using DBCO-PEG4-maleimide heterobifunctional cross-linker
Because of its small size, the EphB4-binding peptide (TNYLFSPNGPIARAWGSGSC, approximately 2 kDa) (Bachem Americas, Inc.) (49) was reacted, at a twofold excess, with the DBCO-PEG4-maleimide (Jena Bioscience) cross-linker, as outlined in the above section for conjugating proteins of interest with an oligo label. The conjugation was reacted overnight at 4°C on a tube rotator. The resulting DBCO-reacted peptide was reacted again, at a threefold molar excess, with an azide-terminated oligo label overnight at 4°C on a tube rotator. Completion of the reaction was confirmed through visualization of a band shift on a 20% PA gel (fig. S11). In the case where overlabeling may be a concern, protein activity can be compared before and after conjugation. Oligonucleotide-labeled peptide was stored at −20°C until ready to use.
DNA-directed patterning of oligonucleotide-labeled proteins
Similar to the above protocol for characterizing surface DNA patterns with a complementary fluorescent oligonucleotide, substrates were first blocked at room temperature with 2% BSA in PBS for 1 hour to minimize nonspecific adsorption. Complementary, oligonucleotide-labeled fluorescent proteins were prepared at 0.2 μM in 2% BSA and incubated for 5 min on a shaker at room temperature. The substrate surface was then washed four times with PBS and imaged using an IXM high-throughput, automated imager.
PA patterns for high-throughput single-cell cultures over 5-day differentiation
Upon completion of DNA patterning, a PA grid was fabricated onto the substrates to enable clonal analysis of thousands of single-cell cultures over the course of differentiation. This was achieved by first photopatterning a large-scale array of 141 μm by 141 μm square features (i.e., “microislands”) arranged with a 200-μm pitch using positive photoresist (Shipley 1813). The photoresist squares were patterned such that the surface DNA patterns were positioned and protected beneath the square features. Subsequently, linear PA was dropcast across the substrate surface, reacting with exposed aldehyde groups within unpatterned photoresist areas (fig. S5). Specifically, a 10% PA solution in 10 mM Hepes (pH 7) was first degassed in a desiccator for 10 min to remove dissolved oxygen. Upon activation of the PA solution with 1.5% tetramethylethylenediamine (Bio-Rad) and 0.225% ammonium persulfate (Bio-Rad), 250 μl of the PA mixture was dropcast immediately over the photoresist features, and a Gel Slick (Lonza)–treated glass coverslip was used to spread out the PA solution over the entire DNA-patterned substrate (48). Following 1 hour of polymerization, the coverslip was removed, and the slide was rinsed with DI water to remove unreacted PA. Last, the photoresist defining the PA patterns and protecting the DNA were removed by dissolving in acetone. The slide was rinsed with DI water, dried with dry nitrogen gas, and stored under vacuum.
To characterize the nonbiofouling nature of the patterned PA, substrates were incubated with 1 mg ml−1 of BSA–Alexa Fluor 488 conjugate (Thermo Fisher Scientific) at room temperature for 2 hours on a shaker. Loosely bound protein was removed by washing substrates four times with PBS. Selective protein adsorption to the square microisland features was revealed upon imaging with a fluorescein isothiocyanate filter (fig. S6).
Polydimethylsiloxane stamping of flow cells onto DNA-patterned glass slide
Polydimethylsiloxane (PDMS) flow cells were fabricated using standard soft lithography in which a 10:1 Sylgard 184 prepolymer base:curing agent mixture (Dow Corning) was degassed, poured onto a negative silicon master containing 150-μm-high SU8 channels, and cured for 1 hour in an 80°C oven. Upon complete curing, PDMS flow cells were excised from the negative-relief master using a razor blade and trimmed to fit within one well of a Millicell EZ four-well chamber (EMD Millipore). To ensure strong attachment of the flow cell during both cell/protein patterning as well as long-term culture, PDMS flow cells were bonded to the DNA-patterned glass substrate using a PDMS stamping protocol. Briefly, degassed 10:1 PDMS mixture was spin-coated onto a blank glass slide at 4000 rpm for 30 s to create a thin PDMS film. The prepared PDMS flow cell was subsequently stamped onto this uncured PDMS film such that the flow cell walls were “inked” with uncured PDMS. The flow cell was subsequently affixed over each well of the DNA-patterned glass substrate. The slide was heated at 65°C for 1 hour to cure the PDMS “ink”—thus creating a strong adhesive bond between the flow cell and DNA substrate. Completed slides were stored under vacuum until ready for biopatterning.
Cell culture
Adult rat hippocampal NSCs were isolated previously from 6-week-old female Fischer 344 rats (36). To promote monolayer adhesion, NSCs were cultured on polystyrene plates coated with poly-l-ornithine hydrobromide (10 μg ml−1; Sigma-Aldrich) in sterile DI water overnight at room temperature and laminin (5 μg ml−1; Invitrogen) in sterile PBS overnight at 37°C. NSCs were maintained in Dulbecco’s modified Eagle’s medium/Nutrient Mix F-12 (DMEM/F-12, Invitrogen) with 1% (v/v) N-2 Supplement (Invitrogen) and basic FGF (FGF-2, 20 ng ml−1; PeproTech) and incubated at 37°C and 5% CO2. NSCs were passaged upon 80% confluency using Accutase (Innovative Cell Technologies). For mixed differentiation studies, NSCs were cultured in normal culture media supplemented with 1% fetal bovine serum (FBS) (Invitrogen), 1 μM retinoic acid (Enzo Life Sciences), and 1% penicillin-streptomycin (P/S) (Gibco) in DMEM/F-12 + N-2 Supplement. For studies involving protein patterns, NSCs were cultured in maintenance media (DMEM/F-12 + N-2) supplemented with FGF-2 (0.1 ng ml−1) to promote low proliferation.
MCF-7 cells [American Type Culture Collection (ATCC) HTB-22] were cultured in DMEM (Fisher Scientific), supplemented with 10% FBS, 2 mM l-glutamine, and 1% P/S. MCF-10A cells (ATCC CRL-10317) were cultured in mammary epithelial cell basal medium (ATCC PCS-600-030), supplemented with 0.1% insulin, 0.1% human epidermal growth factor, 0.4% hydrocortisone, and 10% cholera toxin. MDA-MB 231 cells (ATCC HTB-26) were cultured in 50:50 DMEM (Fisher Scientific)/RPMI 1640 (ATCC 30-2001), supplemented with 10% FBS and 1% P/S. HUVECs were cultured in F-12K (Gibco), supplemented with 10% FBS, heparin (0.1 mg/ml; Sigma-Aldrich), and endothelial growth supplement (0.03 mg/ml; Corning). MCF-7s, MCF-10As, MDA-MB 231s, and HUVECs were all maintained at 37°C with 5% CO2 and passaged routinely using 0.25% trypsin/EDTA upon reaching 80% confluency with the exception of the HUVECs, which were passaged with TrypLE Express (Thermo Fisher Scientific).
Fluorescent labeling of cell populations using CellTracker dyes
Cells were prepared as a suspension in PBS at 8 × 10⁶ cells ml−1. CellTracker Violet 2,3,6,7-tetrahydro-9-bromomethyl-1H, 5H-quinolizino(9,1-gh)coumarin, CellTracker Green 5-chloromethylfluorescein diacetate, CellTracker Red CMTPX, and CellTracker Deep Red (Thermo Fisher Scientific) were added to a final concentration of 2.5, 2.5, 2.5, and 1 μM, respectively, and allowed to incubate with the cells for 15 min at room temperature with occasional agitation. To remove excess dye, cells were spun down and resuspended three times in 1 ml of PBS. All subsequent steps involving labeled cells were performed in the dark.
Labeling of cell membrane with lipid-DNA
Cells were detached using either Accutase, trypsin/EDTA, or TrypLE Express and prepared at 8 × 10⁷ cells ml−1 in PBS. Cells were incubated with 5 μM lipid-DNA for 10 min at room temperature and followed immediately by a second incubation with 5 μM coanchor lipid-DNA strand for another 10 min to stabilize the first DNA strand (41, 43). Cells were then washed three times via centrifugation at 3000 rpm for 3 min with PBS and stored on ice until ready for patterning. Lipid oligo sequences are listed in table S1.
Single-NSC patterning and culture
Before cell-patterning experiments, DNA-patterned substrates were blocked with 2% BSA in PBS for 1 hour to minimize nonspecific cell attachment. Oligo-labeled NSCs were resuspended in 2% BSA at 4 × 10⁷ cells ml−1, and 20 μl was injected into the PDMS flow cell. The high cell concentration ensured that the entire DNA-patterned area was covered with oligo-labeled NSCs. Cells were then cycled by pipetting 5 μl of the cell suspension into the inlet of the flow channel and removing 5 μl from the outlet. This action was repeated 10 to 20 times to increase the chance of hybridization between the cell-tethered oligos and complementary, surface-tethered oligos. Unpatterned cells were washed away with PBS. For experiments involving protein patterns, the above steps were repeated with a 0.2 μM solution of the protein(s) of interest in 2% BSA. Upon complete cell and/or protein patterning, 250 μl of the appropriate culture media supplemented with 10 μg ml−1 laminin was added to each well, and the slide was cultured for 5 days with half media changes (minus laminin) every other day to prevent cells from lifting off of the surface.
Immunostaining of NSC differentiation
Following 5 days of differentiation, NSCs were fixed for 5 min at room temperature with 4% (w/v) paraformaldehyde and washed three times for 5 min with PBS. Cells were then blocked and permeabilized at room temperature in PBS containing 5% donkey serum (Sigma-Aldrich) and 0.1% Triton X-100 (PBS-DT) for 1 hour before being incubated overnight at 4°C with the primary antibodies, 1:1000 mouse monoclonal immunoglobulin G (IgG) for tubulin III (Sigma-Aldrich, T8578) and 1:1000 chicken polyclonal IgG for glial fibrillary acidic protein (Abcam, ab4674), diluted in PBS-DT. The following day, cells were washed three times for 5 min with PBS and incubated in the dark with secondary antibodies, 1:250 Alexa Fluor 488 donkey anti-mouse IgG (H + L) (Thermo Fisher Scientific, A-21202) and 1:250 Cy3 or Alexa Fluor 647 donkey anti-chicken IgG (H + L) (Jackson ImmunoResearch, 703-605-155), diluted in PBS-DT on a shaker at room temperature. Cells were subsequently washed three times for 5 min in PBS with 1:1000 4′,6-diamidino-2-phenylindole, dihydrochloride added during the second wash. Samples were stored in PBS before and during imaging.
Statistical analysis
All statistical analysis was performed in MATLAB (R2018a). One-way analysis of variance (ANOVA) was used to test for significant differences between variable means. A P value of less than 0.05 for ANOVA was considered significant. For data with a significant ANOVA result, we used the Tukey-Kramer method to compare between individual groups and test for significance. A P value of less than 0.05 for the Tukey-Kramer method was considered significant. Details on replicates, ANOVA results, and Tukey-Kramer comparisons are provided in the figure captions.
SUPPLEMENTARY MATERIALS
Supplementary material for this article is available at http://advances.sciencemag.org/cgi/content/full/6/12/eaay5696/DC1
Supplementary Materials and Methods
Fig. S1. Characterization and optimization of DNA patterning steps.
Fig. S2. Re-use of PR layer versus new PR layer for multicomponent DNA patterning.
Fig. S3. Tunable multiplexed surface DNA patterns.
Fig. S4. Stability and specificity of DNA-directed eGFP patterns.
Fig. S5. Optimization of PA patterning using photolithography.
Fig. S6. Microfabricated DNA and PA patterns support high-throughput clonal analysis of adult NSCs.
Fig. S7. Characterization of adult NSC viability upon labeling with lipid-oligonucleotides.
Fig. S8. Characterization of adult NSC fitness upon labeling with lipid-oligonucleotides.
Fig. S9. Spatial precision imparted by photolithography provides tight control over heterogeneous intercellular communication.
Fig. S10. DNA-based assembly of HUVEC patterns.
Fig. S11. Multicomponent DNA patterns enable controlled, high-throughput studies of adult NSC niche solid-phase ligand cues, FGF-2 and ephrin-B2, at the single-cell level.
Fig. S12. Soluble versus solid-phase peptide activity in adult NSCs.
Fig. S13. Custom cell tracking pipeline using ilastik and Fiji.
Fig. S14. Tracking changes in average cell occupancy within FGF-2 over time for each individual microisland.
Table S1. Overview of surface-patterned DNA sequences and their complementary fluorescent, cell-labeling and ligand-labeling oligonucleotides.
Table S2. In-depth report of experimental sample number “n”.
Movie S1. Example time-lapse videos of single adult NSC cultures with various spatial organizations of competing solid-phase niche ligands.
This is an open-access article distributed under the terms of the Creative Commons Attribution-NonCommercial license, which permits use, distribution, and reproduction in any medium, so long as the resultant use is not for commercial advantage and provided the original work is properly cited.
REFERENCES AND NOTES
Acknowledgments: We thank J. Kim, N. Cho, and P. Kang for helpful discussions, M. West at UC Berkeley’s QB3 Cell and Tissue Analysis Facility for assistance with microscopy, C. Jeans at UC Berkeley’s QB3 MacroLab for assistance with recombinant protein purification, and Z. Gartner’s laboratory for synthesizing lipid-conjugated oligonucleotides. We also thank W. Scheideler for critical reading of this manuscript. Funding: This work was supported by the following NIH grants: 1R01CA190843-01, 1R21EB019181-01A1, NIH/NCI F32 CA243354-01, and 1R21CA182375-01A1. O.J.S. and R.F.-B. were supported by the National Science Foundation Graduate Research Fellowship. O.J.S. was supported by a Siebel Scholarship and PEO Scholarship. Author contributions: O.J.S., D.V.S., and L.L.S. conceived the project. O.J.S. developed and optimized the photolithographic-based method for DNA multicomponent patterning. O.J.S., R.F.-B., E.C.C., M.K., and S.A.C. conducted DNA patterning and performed data analysis of DNA patterning characterization. O.J.S., E.C.C., and S.A.C. cloned and purified proteins. O.J.S., M.K., and A.W.B. conducted cell patterning. A.W.B. synthesized cell-labeling, lipid-conjugated oligonucleotides. O.J.S. and C.Y. performed conjugation and patterning of oligonucleotide-labeled proteins. O.J.S. performed NSC differentiation experiments with experimental design input from C.Y. and K.I.M., and O.J.S., R.F.-B., and K.I.M. conducted data analysis. O.J.S., D.V.S., and L.L.S. wrote the manuscript with input from the other authors. Competing interests: The authors declare that they have no competing interests. Data and materials availability: All data needed to evaluate the conclusions in the paper are present in the paper and/or the Supplementary Materials. Additional data related to this paper may be requested from the authors.
